


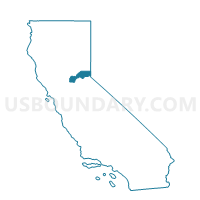
Lincoln CCD, Placer County, California
About
Outline

Summary
| Unique Area Identifier | 124164 |
| Name | Lincoln CCD |
| County | Placer County |
| State | California |
| Area (square miles) | 213.01 |
| Land Area (square miles) | 211.78 |
| Water Area (square miles) | 1.24 |
| % of Land Area | 99.42 |
| % of Water Area | 0.58 |
| Latitude of the Internal Point | 38.89481240 |
| Longtitude of the Internal Point | -121.34646360 |
| Total Population | 66,422 |
| Total Housing Units | 25,907 |
| Total Households | 24,247 |
| Median Age | 38.4 |
Maps

Graphs
Select a template below for downloading or customizing gragh for Lincoln CCD, Placer County, California


Neighbors
Neighoring County Subdivision (by Name) Neighboring County Subdivision on the Map
- Auburn CCD, Placer County, CA
- East Yuba-Beale AFB CCD, Yuba County, CA
- Grass Valley CCD, Nevada County, CA
- Rocklin CCD, Placer County, CA
- Roseville CCD, Placer County, CA
- Sacramento CCD, Sacramento County, CA
- South Sutter CCD, Sutter County, CA
- Wheatland CCD, Yuba County, CA
Top 10 Neighboring Place (by Population) Neighboring Place on the Map
- Roseville city, CA (118,788)
- Rocklin city, CA (56,974)
- Antelope CDP, CA (45,770)
- Lincoln city, CA (42,819)
- Elverta CDP, CA (5,492)
- Wheatland city, CA (3,456)
- Sheridan CDP, CA (1,238)
Top 10 Neighboring Elementary School District (by Population) Neighboring Elementary School District on the Map
- Roseville City Elementary School District, CA (82,163)
- Dry Creek Joint Elementary School District, CA (52,939)
- Pleasant Ridge Union Elementary School District, CA (20,577)
- Loomis Union Elementary School District, CA (19,259)
- Wheatland Elementary School District, CA (7,225)
- Elverta Joint Elementary School District, CA (2,837)
- Newcastle Elementary School District, CA (2,496)
- Browns Elementary School District, CA (950)
- Pleasant Grove Joint Union Elementary School District, CA (879)
- Marcum-Illinois Union Elementary School District, CA (851)
Top 10 Neighboring Secondary School District (by Population) Neighboring Secondary School District on the Map
- Roseville Joint Union High School District, CA (161,902)
- Placer Union High School District, CA (85,905)
- Nevada Joint Union High School District, CA (81,863)
- Wheatland Union High School District, CA (10,944)
- Twin Rivers Unified School District in Elverta, CA (2,837)
- East Nicolaus Joint Union High School District, CA (2,680)
Top 10 Neighboring Unified School District (by Population) Neighboring Unified School District on the Map
- Rocklin Unified School District, CA (56,689)
- Western Placer Unified School District, CA (50,093)
- Center Joint Unified School District, CA (27,508)
Top 10 Neighboring State Legislative District Lower Chamber (by Population) Neighboring State Legislative District Lower Chamber on the Map
- Assembly District 4, CA (536,793)
- Assembly District 2, CA (469,582)
- Assembly District 3, CA (459,287)
Top 10 Neighboring State Legislative District Upper Chamber (by Population) Neighboring State Legislative District Upper Chamber on the Map
- State Senate District 1, CA (1,002,597)
- State Senate District 4, CA (988,287)
- State Senate District 6, CA (914,353)
Top 10 Neighboring 111th Congressional District (by Population) Neighboring 111th Congressional District on the Map
- Congressional District 3, CA (783,317)
- Congressional District 4, CA (774,261)
- Congressional District 2, CA (708,596)
Top 10 Neighboring Census Tract (by Population) Neighboring Census Tract on the Map
- Census Tract 213.09, Placer County, CA (9,552)
- Census Tract 213.22, Placer County, CA (8,762)
- Census Tract 210.35, Placer County, CA (7,431)
- Census Tract 211.23, Placer County, CA (7,397)
- Census Tract 214.03, Placer County, CA (7,000)
- Census Tract 231, Placer County, CA (6,491)
- Census Tract 213.04, Placer County, CA (5,307)
- Census Tract 235, Placer County, CA (5,159)
- Census Tract 232, Placer County, CA (4,960)
- Census Tract 236, Placer County, CA (4,565)
Top 10 Neighboring 5-Digit ZIP Code Tabulation Area (by Population) Neighboring 5-Digit ZIP Code Tabulation Area on the Map
- 95747, CA (51,870)
- 95648, CA (47,354)
- 95843, CA (45,048)
- 95678, CA (41,192)
- 95765, CA (33,974)
- 95603, CA (27,844)
- 95949, CA (19,741)
- 95650, CA (12,447)
- 95658, CA (6,285)
- 95626, CA (5,975)
Data
Demographic, Population, Households, and Housing Units
** Data sources from census 2010 **
Show Data on Map
Download Full List as CSV
Download Quick Sheet as CSV
| Subject | This Area | Placer County | California | National |
|---|---|---|---|---|
| POPULATION | ||||
| Total Population Map | 66,422 | 348,432 | 37,253,956 | 308,745,538 |
| POPULATION, HISPANIC OR LATINO ORIGIN | ||||
| Not Hispanic or Latino Map | 56,209 | 303,722 | 23,240,237 | 258,267,944 |
| Hispanic or Latino Map | 10,213 | 44,710 | 14,013,719 | 50,477,594 |
| POPULATION, RACE | ||||
| White alone Map | 52,664 | 290,977 | 21,453,934 | 223,553,265 |
| Black or African American alone Map | 1,055 | 4,751 | 2,299,072 | 38,929,319 |
| American Indian and Alaska Native alone Map | 568 | 3,011 | 362,801 | 2,932,248 |
| Asian alone Map | 5,159 | 20,435 | 4,861,007 | 14,674,252 |
| Native Hawaiian and Other Pacific Islander alone Map | 166 | 778 | 144,386 | 540,013 |
| Some Other Race alone Map | 3,823 | 13,375 | 6,317,372 | 19,107,368 |
| Two or More Races Map | 2,987 | 15,105 | 1,815,384 | 9,009,073 |
| POPULATION, SEX | ||||
| Male Map | 32,121 | 170,151 | 18,517,830 | 151,781,326 |
| Female Map | 34,301 | 178,281 | 18,736,126 | 156,964,212 |
| POPULATION, AGE (18 YEARS) | ||||
| 18 years and over Map | 49,001 | 263,347 | 27,958,916 | 234,564,071 |
| Under 18 years | 17,421 | 85,085 | 9,295,040 | 74,181,467 |
| POPULATION, AGE | ||||
| Under 5 years | 5,230 | 20,851 | 2,531,333 | 20,201,362 |
| 5 to 9 years | 5,145 | 23,604 | 2,505,839 | 20,348,657 |
| 10 to 14 years | 4,539 | 24,986 | 2,590,930 | 20,677,194 |
| 15 to 17 years | 2,507 | 15,644 | 1,666,938 | 12,954,254 |
| 18 and 19 years | 1,417 | 8,654 | 1,157,002 | 9,086,089 |
| 20 years | 591 | 3,798 | 573,642 | 4,519,129 |
| 21 years | 522 | 3,506 | 555,775 | 4,354,294 |
| 22 to 24 years | 1,614 | 10,632 | 1,636,532 | 12,712,576 |
| 25 to 29 years | 3,751 | 19,560 | 2,744,409 | 21,101,849 |
| 30 to 34 years | 4,631 | 19,613 | 2,573,468 | 19,962,099 |
| 35 to 39 years | 4,834 | 21,871 | 2,573,579 | 20,179,642 |
| 40 to 44 years | 4,416 | 24,694 | 2,609,131 | 20,890,964 |
| 45 to 49 years | 4,110 | 27,232 | 2,689,819 | 22,708,591 |
| 50 to 54 years | 3,474 | 26,107 | 2,562,552 | 22,298,125 |
| 55 to 59 years | 3,207 | 22,972 | 2,204,296 | 19,664,805 |
| 60 and 61 years | 1,553 | 8,591 | 786,276 | 7,113,727 |
| 62 to 64 years | 2,699 | 12,555 | 1,045,921 | 9,704,197 |
| 65 and 66 years | 1,675 | 7,067 | 568,817 | 5,319,902 |
| 67 to 69 years | 2,404 | 9,392 | 734,741 | 7,115,361 |
| 70 to 74 years | 3,327 | 12,531 | 971,778 | 9,278,166 |
| 75 to 79 years | 2,364 | 10,019 | 766,971 | 7,317,795 |
| 80 to 84 years | 1,418 | 7,299 | 603,239 | 5,743,327 |
| 85 years and over | 994 | 7,254 | 600,968 | 5,493,433 |
| MEDIAN AGE BY SEX | ||||
| Both sexes Map | 38.40 | 40.30 | 35.20 | 37.20 |
| Male Map | 37.30 | 39.00 | 34.00 | 35.80 |
| Female Map | 39.50 | 41.40 | 36.30 | 38.50 |
| HOUSEHOLDS | ||||
| Total Households Map | 24,247 | 132,627 | 12,577,498 | 116,716,292 |
| HOUSEHOLDS, HOUSEHOLD TYPE | ||||
| Family households: Map | 18,401 | 93,536 | 8,642,473 | 77,538,296 |
| Husband-wife family Map | 15,637 | 75,509 | 6,213,310 | 56,510,377 |
| Other family: Map | 2,764 | 18,027 | 2,429,163 | 21,027,919 |
| Male householder, no wife present Map | 896 | 5,771 | 752,347 | 5,777,570 |
| Female householder, no husband present Map | 1,868 | 12,256 | 1,676,816 | 15,250,349 |
| Nonfamily households: Map | 5,846 | 39,091 | 3,935,025 | 39,177,996 |
| Householder living alone Map | 4,641 | 30,496 | 2,929,442 | 31,204,909 |
| Householder not living alone Map | 1,205 | 8,595 | 1,005,583 | 7,973,087 |
| HOUSEHOLDS, HISPANIC OR LATINO ORIGIN OF HOUSEHOLDER | ||||
| Not Hispanic or Latino householder: Map | 21,581 | 120,364 | 9,192,322 | 103,254,926 |
| Hispanic or Latino householder: Map | 2,666 | 12,263 | 3,385,176 | 13,461,366 |
| HOUSEHOLDS, RACE OF HOUSEHOLDER | ||||
| Householder who is White alone | 20,478 | 116,215 | 8,129,331 | 89,754,352 |
| Householder who is Black or African American alone | 369 | 1,715 | 835,651 | 14,129,983 |
| Householder who is American Indian and Alaska Native alone | 194 | 1,061 | 113,235 | 939,707 |
| Householder who is Asian alone | 1,544 | 6,300 | 1,529,789 | 4,632,164 |
| Householder who is Native Hawaiian and Other Pacific Islander alone | 43 | 246 | 38,238 | 143,932 |
| Householder who is Some Other Race alone | 984 | 3,682 | 1,497,993 | 4,916,427 |
| Householder who is Two or More Races | 635 | 3,408 | 433,261 | 2,199,727 |
| HOUSEHOLDS, HOUSEHOLD TYPE BY HOUSEHOLD SIZE | ||||
| Family households: Map | 18,401 | 93,536 | 8,642,473 | 77,538,296 |
| 2-person household Map | 8,274 | 40,637 | 2,887,696 | 31,882,616 |
| 3-person household Map | 3,451 | 19,823 | 1,904,697 | 17,765,829 |
| 4-person household Map | 3,698 | 19,621 | 1,823,355 | 15,214,075 |
| 5-person household Map | 1,792 | 8,652 | 1,018,257 | 7,411,997 |
| 6-person household Map | 738 | 3,080 | 497,773 | 3,026,278 |
| 7-or-more-person household Map | 448 | 1,723 | 510,695 | 2,237,501 |
| Nonfamily households: Map | 5,846 | 39,091 | 3,935,025 | 39,177,996 |
| 1-person household Map | 4,641 | 30,496 | 2,929,442 | 31,204,909 |
| 2-person household Map | 988 | 6,914 | 766,106 | 6,360,012 |
| 3-person household Map | 140 | 1,073 | 139,115 | 992,156 |
| 4-person household Map | 49 | 394 | 60,096 | 411,171 |
| 5-person household Map | 18 | 146 | 22,151 | 126,634 |
| 6-person household Map | 6 | 47 | 9,698 | 48,421 |
| 7-or-more-person household Map | 4 | 21 | 8,417 | 34,693 |
| HOUSING UNITS | ||||
| Total Housing Units Map | 25,907 | 152,648 | 13,680,081 | 131,704,730 |
| HOUSING UNITS, OCCUPANCY STATUS | ||||
| Occupied Map | 24,247 | 132,627 | 12,577,498 | 116,716,292 |
| Vacant Map | 1,660 | 20,021 | 1,102,583 | 14,988,438 |
| HOUSING UNITS, OCCUPIED, TENURE | ||||
| Owned with a mortgage or a loan Map | 15,277 | 73,357 | 5,465,345 | 52,979,430 |
| Owned free and clear Map | 4,154 | 20,866 | 1,570,026 | 23,006,644 |
| Renter occupied Map | 4,816 | 38,404 | 5,542,127 | 40,730,218 |
| HOUSING UNITS, VACANT, VACANCY STATUS | ||||
| For rent Map | 369 | 3,080 | 374,610 | 4,137,567 |
| Rented, not occupied Map | 15 | 195 | 20,347 | 206,825 |
| For sale only Map | 557 | 2,284 | 154,775 | 1,896,796 |
| Sold, not occupied Map | 138 | 481 | 34,288 | 421,032 |
| For seasonal, recreational, or occasional use Map | 196 | 12,020 | 302,815 | 4,649,298 |
| For migrant workers Map | 5 | 9 | 2,100 | 24,161 |
| Other vacant Map | 380 | 1,952 | 213,648 | 3,652,759 |
| HOUSING UNITS, OCCUPIED, AVERAGE HOUSEHOLD SIZE BY TENURE | ||||
| Total: Map | 2.72 | 2.60 | 2.90 | 2.58 |
| Owner occupied Map | 2.65 | 2.64 | 2.95 | 2.65 |
| Renter occupied Map | 2.98 | 2.50 | 2.83 | 2.44 |
| HOUSING UNITS, OCCUPIED, TENURE BY RACE OF HOUSEHOLDER | ||||
| Owner occupied: Map | 19,431 | 94,223 | 7,035,371 | 75,986,074 |
| Householder who is White alone Map | 16,615 | 83,952 | 4,996,053 | 63,446,275 |
| Householder who is Black or African American alone Map | 275 | 997 | 310,834 | 6,261,464 |
| Householder who is American Indian and Alaska Native alone Map | 131 | 632 | 52,963 | 509,588 |
| Householder who is Asian alone Map | 1,353 | 4,782 | 878,924 | 2,688,861 |
| Householder who is Native Hawaiian and Other Pacific Islander alone Map | 34 | 140 | 16,570 | 61,911 |
| Householder who is Some Other Race alone Map | 537 | 1,721 | 589,196 | 1,975,817 |
| Householder who is Two or More Races Map | 486 | 1,999 | 190,831 | 1,042,158 |
| Renter occupied: Map | 4,816 | 38,404 | 5,542,127 | 40,730,218 |
| Householder who is White alone Map | 3,863 | 32,263 | 3,133,278 | 26,308,077 |
| Householder who is Black or African American alone Map | 94 | 718 | 524,817 | 7,868,519 |
| Householder who is American Indian and Alaska Native alone Map | 63 | 429 | 60,272 | 430,119 |
| Householder who is Asian alone Map | 191 | 1,518 | 650,865 | 1,943,303 |
| Householder who is Native Hawaiian and Other Pacific Islander alone Map | 9 | 106 | 21,668 | 82,021 |
| Householder who is Some Other Race alone Map | 447 | 1,961 | 908,797 | 2,940,610 |
| Householder who is Two or More Races Map | 149 | 1,409 | 242,430 | 1,157,569 |
| HOUSING UNITS, OCCUPIED, TENURE BY HISPANIC OR LATINO ORIGIN OF HOUSEHOLDER | ||||
| Owner occupied: Map | 19,431 | 94,223 | 7,035,371 | 75,986,074 |
| Not Hispanic or Latino householder Map | 17,710 | 87,528 | 5,529,138 | 69,617,625 |
| Hispanic or Latino householder Map | 1,721 | 6,695 | 1,506,233 | 6,368,449 |
| Renter occupied: Map | 4,816 | 38,404 | 5,542,127 | 40,730,218 |
| Not Hispanic or Latino householder Map | 3,871 | 32,836 | 3,663,184 | 33,637,301 |
| Hispanic or Latino householder Map | 945 | 5,568 | 1,878,943 | 7,092,917 |
| HOUSING UNITS, OCCUPIED, TENURE BY HOUSEHOLD SIZE | ||||
| Owner occupied: Map | 19,431 | 94,223 | 7,035,371 | 75,986,074 |
| 1-person household Map | 3,504 | 18,013 | 1,340,915 | 16,453,569 |
| 2-person household Map | 8,091 | 36,978 | 2,269,063 | 27,618,605 |
| 3-person household Map | 2,789 | 14,713 | 1,164,562 | 12,517,563 |
| 4-person household Map | 2,945 | 15,085 | 1,129,739 | 10,998,793 |
| 5-person household Map | 1,324 | 6,211 | 577,673 | 5,057,765 |
| 6-person household Map | 503 | 2,116 | 273,058 | 1,965,796 |
| 7-or-more-person household Map | 275 | 1,107 | 280,361 | 1,373,983 |
| Renter occupied: Map | 4,816 | 38,404 | 5,542,127 | 40,730,218 |
| 1-person household Map | 1,137 | 12,483 | 1,588,527 | 14,751,340 |
| 2-person household Map | 1,171 | 10,573 | 1,384,739 | 10,624,023 |
| 3-person household Map | 802 | 6,183 | 879,250 | 6,240,422 |
| 4-person household Map | 802 | 4,930 | 753,712 | 4,626,453 |
| 5-person household Map | 486 | 2,587 | 462,735 | 2,480,866 |
| 6-person household Map | 241 | 1,011 | 234,413 | 1,108,903 |
| 7-or-more-person household Map | 177 | 637 | 238,751 | 898,211 |
Loading...